Fast Optimization
Fast optimization enables you to stop the specific test if it reaches one of limits.
For example, you can stop the test on big drawdown, or if number of trades is too low.
This can save a lot of time and resources.
Attention
Fast optimization works in MT5 onlyMax DrawDown %
If the drawdown reaches this value, the test will be stopped.
Set 0 to disable this limit.
Min Trades per year
If the number of trades per year is less than this value, the test will be stopped.
For example, if you set 50, and after the first year there are only 40 trades, the test will be stopped.
The check starts after 6 months of testing.
Set 0 to disable this limit.
Tester withdrawal
Withdrawal type
- Disabled - don’t use tester withdrawal.
-
Withdraw percent of profit - withdraw specified percent of profit.
For example, you set to withdraw 50% every day. If you have a profit of $50 at the end of the day, $25 is withdrawn. Set 100% to withdraw all profits you made.
-
Withdraw fixed amount - withdraw specified amount of profit (in your account currency).
For example, you set to withdraw $45 every day. If you have a profit of $50 at the end of the day, $45 is withdrawn.
Withdrawal amount can’t be more than the profit made since the last withdrawal!
For example, if you set to withdraw $45 every day but only $10 is made at the end of the day, only $10 is withdrawn.
Withdrawal frequency
Frequency of withdrawals. Can be:
- Withdraw every day
- Withdraw every week
- Withdraw every month
- Withdraw every quarter
- Withdraw every year
Withdrawal size (% or amount)
Percent or amount in account currency for each withdrawal.
Optimization criterion
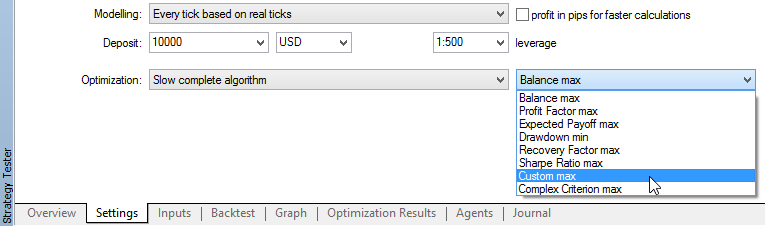
Starting from v2.27 you can use custom optimization criterion.
To do this, select “Custom max” in the Strategy Tester settings:
and enable corresponding parameter in the EA settings:

Custom criterion value (R-squared or Max Relative DrawDown) will be shown in the “Result” column of Optimization results:

Custom optimization criterion
- Disabled - don’t use custom criterion.
-
R^2 on equity - use R-squared as an estimation of quality of the strategy equity curve (read this article for details).
Greater value is better with 1 as maximum possible value (ideal equity going up-right without any volatility).
You should use Fixed start lot size when optimizing using the R-squared because of the nature of this criterion.
-
Max Relative DD (starting from v2.29) – use Maximal relative DrawDown (in percent) based on equity.
Result is shown as negative value to make genetic optimization possible (greater value should be better), so -17.5 in the results column means 17.5% DD
-
Lowest margin level (starting from v2.58) – use the lowest margin level (in percent).
Use this criterion to detect strategies with high risk of margin call.
-
Profit to Max Relative Drawdown ratio (starting from v2.59) – use the ratio of Profit (in account currency) to Max Relative Drawdown (in percent) based on equity.
Greater value is better.
-
Win ratio (starting from v3.2.1) – use the ratio of profitable trades to total trades.
Greater value is better.
Correlation type
Correlation calculation type for R^2 criterion:
- Pearson’s correlation
- Spearman’s Rank-Order correlation
Trades per year: min and good
Works with R^2 criterion only.
If defined, final result is adjusted by coefficient that calculated as:
- 0 – if the “fact number of trades per year” < “min”
- 1 – if the “fact number of trades per year” >= “good”
- in a range [0:1] – if the “fact number of trades per year” is between “min” and “good”
For example, if you set “min” to 100 and “good” to 200, and “fact number of trades per year” is 150, then coefficient will be 0.5
If you set only “min” value (“good” = 0, means disabled), then adjustment will be made only if “fact number of trades per year” < “min” (coefficient will be 0).
More examples for different settings:
| R^2 | min | good | trades per year |
adjustment coefficient |
final result |
|---|---|---|---|---|---|
| 0.9 | 100 | 200 | 50 | 0 | 0.0 |
| 0.9 | 100 | 200 | 150 | 0.5 | 0.45 |
| 0.9 | 100 | 200 | 250 | 1 | 0.9 |
| 0.9 | 100 | 0 | 75 | 0 | 0.0 |
| 0.9 | 100 | 0 | 125 | 1.0 | 0.9 |
| 0.9 | 100 | 0 | 175 | 1.0 | 0.9 |
| 0.5 | 10 | 1000 | 100 | 0.09 | 0.045 |
| 0.5 | 10 | 1000 | 505 | 0.5 | 0.25 |
| 0.5 | 10 | 1000 | 901 | 0.9 | 0.45 |
| 0.5 | 10 | 1000 | 1000 | 1.0 | 0.5 |
| 0.5 | 10 | 1000 | 3576 | 1.0 | 0.5 |
As you can see, adjustment coefficient can only decrease the final result for low number of trades per year. After “good” value is reached, adjustment coefficient is 1.0 and doesn’t change the final result.
Custom Start and End dates
The purpose of Custom Start date is to ensure that all necessary historical data is loaded for all indicators (some indicators require more than 1 year of history, which is available in the tester by default).
The purpose of the Custom End Date is to avoid starting a new series of trades at the end of the test period, so that all trades will be more likely to be closed before the end of the test.
Custom Intervals File Name
If defined, EA will read custom intervals from the file with this name and use them for the test (will skip all the ticks outside of these intervals).
File should be located in the common folder of all MetaTraders on your PC: C:\Users\\your_name\\AppData\Roaming\MetaQuotes\Terminal\Common\Files\ or its subfolders.
To get there, you can use the “Open data folder” command in the terminal (File -> Open data folder).
File format should be like this:
2022.01.01 00:00-2022.01.02 00:00
2022.01.03 12:00-2022.01.04 12:00
The rows number is not limited. Each row should contain ‘-‘ as a separator between start and end date-time.
At the end of each interval, EA will close all the trades and will “sleep” until the beginning of the next interval.
This feature may be useful for testing and optimizing the EA on the specific market conditions like extremely volatile or flat markets.