Signals and filters
Directional change filter
Directional change filter allows to filter entries based on previous closed trade direction and its profit.
Directional change filter type
Disabled: filter disabled
Change dir after loss:
- allows BUYs after profitable BUYs / after losing SELLs
- allows SELLs after profitable SELLs / after losing BUYs
Change dir after profit (starting from v2.58):
- allows BUYs after losing BUYs / after profitable SELLs
- allows SELLs after losing SELLs / after profitable BUYs
Big candle filter
Big candle filter analyzes candle (current or previous, depending on Analyze current bar parameter) from the specified timeframe and allows entry only if candle size is in the specified range.
Big candle filter type
- Disabled: filter disabled
- Big candle in any direction:
- both BUYs and SELLs are allowed only if High - Low >= Big candle min size and High - Low <= Big candle max size (or max size = 0)
- Co-directional big candle only:
- BUYs are allowed if High - Open >= Big candle min size and High - Open <= Big candle max size (or max size = 0)
- SELLs are allowed if Open - Low >= Big candle min size and Open - Low <= Big candle max size (or max size = 0)
- Opposite big candle only:
- BUYs are allowed if Open - Low >= Big candle min size and Open - Low <= Big candle max size (or max size = 0)
- SELLs are allowed if High - Open >= Big candle min size and High - Open <= Big candle max size (or max size = 0)
Big candle calculation mode
Can be set:
- In Points (what is a “point”?)
- As a Volatility Coefficient (volatility parameters must be set correctly)
- As a Percentage of Price (asset price * Percentage / 100)
Big candle min size
Min candle size to activate signal.
Big candle max size
Max candle size to activate signal.
Set 0 to disable max size check.
Big candle TimeFrame
TimeFrame to analyze candle size.
Analyze current bar
Set true to analyze current bar, false to analyze previous (formed) bar.
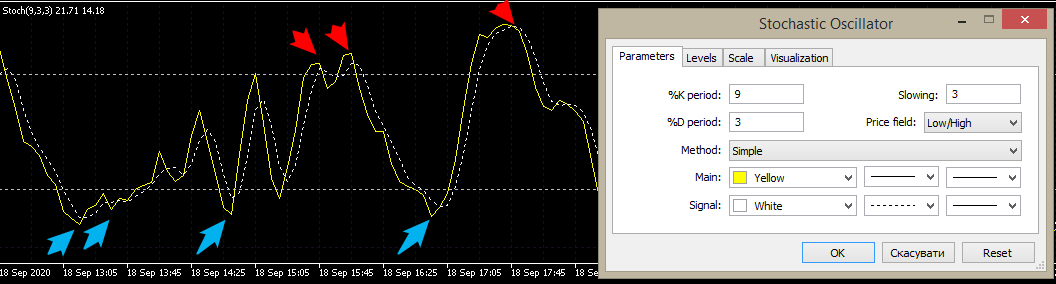
Oscillator filters #1-3
Filter type
Type of oscillator signal:
- Disabled: filter disabled.
- Inside zone:
- BUYs are allowed if oscillator <= LevelDn
- SELLs are allowed if oscillator >= LevelUp
- Cross In:
- BUYs are allowed when oscillator crosses LevelDn downwards
- SELLs are allowed when oscillator crosses LevelUp upwards
- Cross Out:
- BUYs are allowed when oscillator crosses LevelDn upwards
- SELLs are allowed when oscillator crosses LevelUp downwards
- Cross MA:
- BUYs are allowed when oscillator crosses MA based on its line below the LevelDn
- SELLs are allowed when oscillator crosses MA based on its line above the LevelUp
For example:
- Above/below MA (starting from v2.35):
- BUYs are allowed if oscillator > MA based on its line and <= LevelDn
- SELLs are allowed when oscillator < MA based on its line and >= LevelUp
- Reversal (starting from v2.52):
- BUYs are allowed if oscillator turns UP below the LevelDn (middle bar should be below the level)
- SELLs are allowed if oscillator turns DOWN above the LevelUp (middle bar should be above the level)
Indicator
Indicator used for oscillator signal.
Can be one of the following:
- CCI
- WPR
- RSI
- Stochastic K
- Stochastic D (starting from v2.21)
- Momentum (starting from v2.16)
- Force Index (starting from v2.56)
TimeFrame
TimeFrame to calculate signal.
Main Period
Period of oscillator (K period for Stochastic)
Applied price
Applied price for CCI and RSI
MA Period
MA period for Cross MA mode
MA Method
MA method for Cross MA mode
Stochastic Slowing period and Price
Stochastic parameters
Level UP
Signal level for sell signals
Level DN
Signal level for buy signals.
Set -999 to calculate it automatically based on Level Up (for faster optimization).
For Stochastic and RSI, level is mirrored from 50:
- Up = 90 —> Dn = 10
- Up = 70 —> Dn = 30
- Up = 50 —> Dn = 50
For WPR – from -50:
- Up = -10 —> Dn = -90
- Up = -20 —> Dn = -80
- Up = -50 —> Dn = -50
For CCI – from 0:
- Up = 100 —> Dn = -100
- Up = 150 —> Dn = -150
- Up = 0 —> Dn = 0
Reverse mode
Reverse all Oscillator signals.
Use closed bars only
Use only closed (formed) bars. If true, the signal can’t change in the middle of the bar.
Default value for Oscillator filters is true
IdentifyTrend filter
Enable IdentifyTrend filter
If true:
- BUYs are allowed if IdentifyTrend is blue
- SELLs are allowed if IdentifyTrend is red
Set false to disable this filter.
You don’t need the IdentifyTrend indicator file for the correct work of EA. However, you can get it here, if you want.
IdentifyTrend TimeFrame
TimeFrame for the IdentifyTrend filter
IdentifyTrend Price, IdentifyTrend Period
Price and period for IdentifyTrend calculation
IdentifyTrend Reverse mode
Reverse all IdentifyTrend signals (Buy on Red and Sell on Blue)
IdentifyTrend use closed bars only
Use only closed (formed) bars. If true, the signal can’t change in the middle of the bar.
Default value for IdentifyTrend is false.
TDI filter
TDI – is a well-known oscillator based on RSI:

You don’t need the TDI indicator file for the correct work of EA. However, you can get it here, if you want
TDI filter mode
TDI filter type, can be one of the following:
- Disabled - TDI filter is disabled
- Market Base Line > Signal Level:
- BUYs are allowed if TDI yellow line is >= Signal level
- SELLs are allowed if TDI yellow line is <= Signal level
TDI TimeFrame
TimeFrame for the TDI filter
Signal level
Signal level for signal calculation
TDI indicator parameters
- RSI period and price
- RSI smoothing period and method
- Signal smoothing period and method
- Volatility bands period
- Standard Deviations
TDI Reverse mode
Reverse all TDI signals
TDI use closed bars only
Use only closed (formed) bars. If true, the signal can’t change in the middle of the bar.
Default value for TDI is true.
MACD filter
MACD filter Type
Type of MACD filter:
- Disabled: MACD filter disabled
- Buy on Main > 0 / Sell on Main < 0:
- BUYs are allowed if MACD histogram > Signal Level
- SELLs are allowed if MACD histogram < -Signal Level
- Buy on 2 growing bars / Sell on 2 reducing bars:
- BUYs are allowed if MACD is growing (value on the last bar is greater than previous one)
- SELLs are allowed if MACD is reducing (value on the last bar is less than previous one)
- Buy on 3 growing bars / Sell on 3 reducing bars:
- BUYs are allowed if MACD is growing 3 bars in a row
- SELLs are allowed if MACD is reducing 3 bars in a row
- Buy on Main > Signal / Sell on Main < Signal:
- BUYs are allowed if MACD histogram > MACD Signal line
- SELLs are allowed if MACD histogram < MACD Signal line
- Main and Signal cross:
- BUYs are allowed on the bar where MACD histogram crosses MACD Signal line upwards
- SELLs are allowed on the bar where MACD histogram crosses MACD Signal line downwards
- Main and Signal cross >/< 0:
- BUYs are allowed on the bar where MACD histogram crosses MACD Signal line upwards below the -Signal Level
- SELLs are allowed on the bar where MACD histogram crosses MACD Signal line downwards above the Signal Level
- Buy on Signal > 0 / Sell on Signal < 0 (starting from 2.35):
- BUYs are allowed if MACD signal line > Signal Level
- SELLs are allowed if MACD signal line < -Signal Level
- Buy on Main > Signal and Signal < 0 / Sell on Main < Signal and Signal > 0 (starting from 2.35):
- BUYs are allowed if MACD histogram > MACD Signal line and MACD signal line < -Signal Level
- SELLs are allowed if MACD histogram < MACD Signal line and MACD signal line > Signal Level
- Main cross 0 (starting from v2.48):
- BUYs are allowed on the bar where MACD histogram crosses Signal Level upwards
- SELLs are allowed on the bar where MACD histogram crosses -Signal Level downwards
- Signal cross 0 (starting from v2.48):
- BUYs are allowed on the bar where MACD Signal line crosses Signal Level upwards
- SELLs are allowed on the bar where MACD Signal line crosses -Signal Level downwards
MACD TimeFrame
TimeFrame for the MACD filter
MACD Signal Level
Signal level for all filter types where it is used
MACD indicator parameters
- MACD Fast period
- MACD Fast method
- MACD Slow period
- MACD Slow method
- MACD Signal period
- MACD Signal method
- MACD Applied price
MACD Reverse mode
Reverse all MACD signals
MACD use closed bars only
Use only closed (formed) bars. If true, the signal can’t change in the middle of the bar.
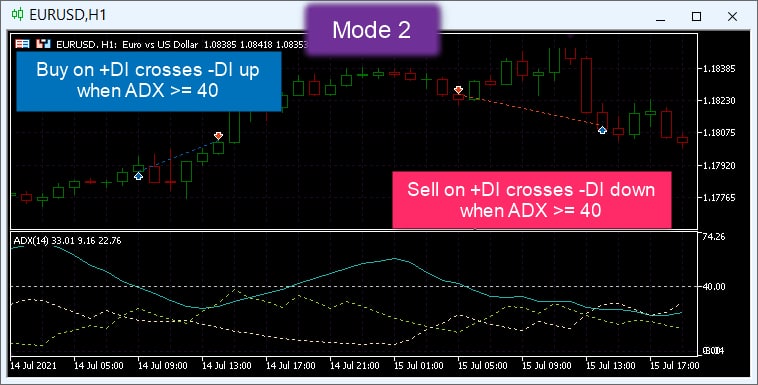
ADX filter
Type
Type of ADX filter:
- Disabled: filter disabled
- Buy on +DI <= level / Sell on -DI <= level:
- BUYs are allowed if +DI value <= Signal level
- SELLs are allowed if -DI value <= Signal level

- Buy on +DI >= level / Sell on -DI >= level (starting from v2.52):
- BUYs are allowed if +DI value >= Signal level
- SELLs are allowed if -DI value >= Signal level
- Buy/sell on +DI crosses -DI up/down when ADX >= level:
- BUYs are allowed if ADX >= Signal level and +DI line crosses -DI line up
- SELLs are allowed if ADX >= Signal level and +DI line crosses -DI line down
- Buy/sell when ADX >= level (starting from v2.52):
- Both BUYs and SELLs are allowed if ADX >= Signal level
TimeFrame
TimeFrame for the ADX filter
Period Applied price
ADX indicator parameters (for MT4 only)
Signal level
Signal level value
Reverse mode
If true, buy signals replaced by sell signals and vice versa.
Use closed bars only
Use only closed (formed) bars. If true, the signal can’t change in the middle of the bar.
Default value for ADX is true.
DTrend filter
Type
Type of DTrend filter:
- Disabled: filter disabled
- Buy > level / Sell < -level:
- BUYs are allowed if indicator value > Signal level
- SELLs are allowed if indicator value < -Signal level
- Buy on rise / Sell on fall:
- BUYs are allowed if indicator grows
- SELLs are allowed if indicator falls
- Buy on bottom / Sell on top:
- BUYs are allowed if indicator starts to grow
- SELLs are allowed if indicator starts to fall
TimeFrame
TimeFrame for the DTrend filter
DTrend indicator parameters
- MA1 period
- MA2 period
- D period
- Scalar
Signal level
Level value for Buy > level / Sell < -level mode
Reverse mode
Reverse all DTrend signals
Use closed bars only
Use only closed (formed) bars. If true, the signal can’t change in the middle of the bar.
Default value for DTrend is false.
Parabolic SAR filter
Signal Type
Type of Parabolic filter:
- Disabled: filter disabled
- Direction:
- BUYs are allowed if price is above the Parabolic
- SELLs are allowed if price is below the Parabolic
- Signal:
- BUYs are allowed if price crosses the Parabolic upward
- SELLs are allowed if price crosses the Parabolic downward
TimeFrame
TimeFrame for the Parabolic filter
Step Maximum
Parabolic indicator parameters
Reverse mode
Reverse all Parabolic signals
MA Filters
(starting from v2.15, refactored in 2.53)
MA Filter Type
Type of MA filter:
-
Disabled: MA filter is disabled
- Buy below MA / Sell above MA:
- BUYs are allowed if current price is below the MA by Distance:
- MA - price >= Distance
- SELLs are allowed if current price is above the MA by Distance:
- price - MA >= Distance
- BUYs are allowed if current price is below the MA by Distance:
- Buy on cross DN / Sell on cross UP:
- BUYs are allowed if price crosses the MA upward by Distance:
- MA - price >= Distance [on current bar]
- MA - price < Distance [on previous bar]
- SELLs are allowed if price crosses the MA downward by Distance:
- price - MA >= Distance [on current bar]
- price - MA < Distance [on previous bar]
- BUYs are allowed if price crosses the MA upward by Distance:
- Buy on rising MA / Sell on falling MA:
- BUYs are allowed if the MA rises with a slope >= Angle
- SELLs are allowed if the MA falls with a slope >= Angle
Slope is calculated as (MA[1] - MA[2]), meaning that the MA should change by Angle points per bar to generate a signal
Price depends on the Use closed bars only and Use price parameters:
- If Use closed bars only = true:
- Price on current bar = Open price of the current bar
- Price on previous bar = Open price of the previous bar
- If Use closed bars only = false:
- Price on current bar depends on the Use price parameter
- Price on previous bar = Open price of the previous bar
MA on the current bar is corrected by the half of the ‘normal’ spread. Thus, signals for the symbols with high spread will be symmetrical.
TimeFrame
TimeFrame for MA filter
Moving Average properties
- MA Period
- MA Method
- Applied price
Starting from v3.01, if Applied price is set to PRICE_LOW, MA(PRICE_HIGH) is used for Sell signals. Thus, you can use the only one MA filter and have symmetrical signals for Buy and Sell.
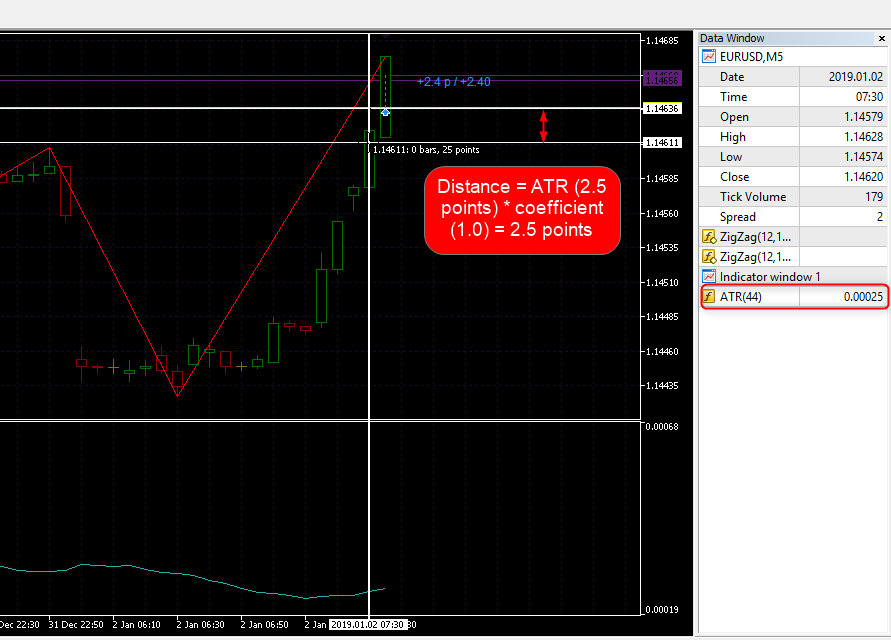
Distance / angle calculation type
Distance / angle calculation type:
- In Points (what is a “point”?)
- As a Volatility Coefficient (volatility parameters must be set correctly)
- As a Percentage of Price (asset price * Percentage / 100)
Distance / angle value
Distance or angle value for signal calculation.
Distance can be negative (so, in Buy below MA mode, BUYs will be allowed if price above the MA, but not more than by distance points).
Angle is set in points per bar (for example, 1.5 points per bar means MA changed by 1.5 points), or as “current volatility * Coefficient” per bar (for example, if volatility = 20 points, and Distance / angle value = 0.1, MA should change by 20*0.1 = 2 points per bar to generate signal).
Angle value also can be negative, so in Buy on rising MA mode BUY will be allowed on falling MA, but it shouldn’t fall too fast (slope still should be >= Angle).
Max Distance / Angle value
Max distance / angle value.
For example, if Distance value = 10, Max Distance value = 20, Buy below MA signal will be active if Max Distance >= MA - price >= Distance.
Set 0 to disable this limit.
Use price
Price to use for MA filter signals. Can be one of the following:
- Co-directional: Use Ask for BUYs, Bid for SELLs
- Opposite: Use Bid for BUYs, Ask for SELLs
- Bid: Use Bid for both BUYs and SELLs
- Ask: Use Ask for both BUYs and SELLs
- Avg: Use (Ask + Bid) / 2 for both BUYs and SELLs
Reverse mode
Reverse all Moving Average (MA) signals
Use closed bars only
Use only closed (formed) bars.
If true, the signal can’t change in the middle of the bar.
Line Filters
Line filter allows to use a graphical object as a filter.
Activate it with specific Object name, create a trend or horizontal line on the chart with the EA, and rename it with the same name as you set in filter parameters.
Attention
Chart objects don't work in the MT5 visual tester mode, so you can test it on history in MT4 onlyAttention
Line filter doesn't work for foreign symbols in multi-symbol version of EA
Line Filter Type
Type of Line filter:
-
Disabled: Line filter is disabled
- Buy below Line / Sell above Line:
- BUYs are allowed if current price is below the line by Distance:
- Line - price >= Distance
- SELLs are allowed if current price is above the Line by Distance:
- price - Line >= Distance
- BUYs are allowed if current price is below the line by Distance:
- Buy on cross DN / Sell on cross UP:
- BUYs are allowed if price crosses the Line upward by Distance:
- Line - price >= Distance [on current bar]
- Line - price < Distance [on previous bar]
- SELLs are allowed if price crosses the Line downward by Distance:
- price - Line >= Distance [on current bar]
- price - Line < Distance [on previous bar]
- BUYs are allowed if price crosses the Line upward by Distance:
Price depends on the “Use closed bars only” parameter:
- If “Use closed bars only” = false:
- Price on current bar = Ask for BUYs, Bid for SELLs
- Price on previous bar = Open price of the previous bar
- If “Use closed bars only” = true:
- Price on current bar = Open price of the current bar
- Price on previous bar = Open price of the previous bar
TimeFrame
TimeFrame for Line filter
Object name
Name of the graphical object to use as a Line filter
Distance calculation type
Distance calculation type:
- In Points (what is a “point”?)
- As a Volatility Coefficient (volatility parameters must be set correctly)
- As a Percentage of Price (asset price * Percentage / 100)
Distance value
Distance value for signal calculation.
Distance can be negative (so, in Buy below Line mode, BUYs will be allowed if Ask above the Line, but not more than by distance points).
Max Distance value
Max distance value.
For example, if Distance value = 10, Max Distance value = 20, Sell above Line signal will be active if Max Distance >= price - Line >= Distance.
Set 0 to disable this limit.
Reverse mode
Reverse all Line filter signals
Use closed bars only
Use only closed (formed) bars.
If true, the signal can’t change in the middle of the bar.
Pivot Filter
Pivot symbol
Symbol to calculate Pivot. Leave empty to use current symbol.
Pivot calculation mode
Pivot calculation mode can be one of the following:
- Classic
- Woodie
- Camarilla
- Fibonacci
- Demark
Pivot TimeFrame
TimeFrame to calculate Pivot
Check Interval
Pivot signals can be checked on every tick, or on every bar of the specified TimeFrame.
Use Every tick for the most accurate signals.
Distance calculation type
Distance calculation type:
- In Points (what is a “point”?)
- As a Volatility Coefficient (volatility parameters must be set correctly)
- As a Percentage of Price (asset price * Percentage / 100)
Visualization properties
Enable visualization to understand signals better. You can choose:
- Lines width
- Lines style
- Pivot Level Color
- Support Levels Color
- Resistance Levels Color
Set Lines width = 0 to disable visualization.
Pivot Level #1-4 properties
Type
Type of Pivot filter:
-
Disabled: filter disabled
- Buy below Level / Sell above Level:
- BUYs are allowed if current price is below the level by Distance:
- Level - price >= Distance
- SELLs are allowed if current price is above the level by Distance:
- price - Level >= Distance
- BUYs are allowed if current price is below the level by Distance:
- Buy on cross DN / Sell on cross UP:
- BUYs are allowed if price crosses the level upward by Distance:
- Level - price >= Distance [on current bar]
- Level - price < Distance [on previous bar]
- SELLs are allowed if price crosses the level downward by Distance:
- price - Level >= Distance [on current bar]
- price - Level < Distance [on previous bar]
- BUYs are allowed if price crosses the level upward by Distance:
Price depends on the “Use closed bars only” parameter:
- If “Use closed bars only” = false:
- Price on current bar = Ask for BUYs, Bid for SELLs
- Price on previous bar = Open price of the previous bar
- If “Use closed bars only” = true:
- Price on current bar = Open price of the current bar
- Price on previous bar = Open price of the previous bar
Use level
Level to use as a filter:
- Pivot Level
- Support / Resistance #1
- Support / Resistance #2
- Support / Resistance #3
- Support / Resistance #4
For example, if Use level = Support / Resistance #2 and Type = Buy below Level / Sell above Level, BUYs will be allowed if Ask below the Support #2 and SELLs will be allowed if Bid above the Resistance #2.
For some Pivot calculation modes, not all levels are available.
Distance value
Distance value for signal calculation.
Distance can be negative (so, in Buy below Level mode, BUYs will be allowed if Ask above the level, but not more than by distance points).
Max Distance value
Max distance value.
For example, if Distance value = 10, Max Distance value = 20, Sell above Level signal will be active if Max Distance >= price - Level >= Distance.
Set 0 to disable this limit.
Reverse mode
Reverse all Pivot filter signals
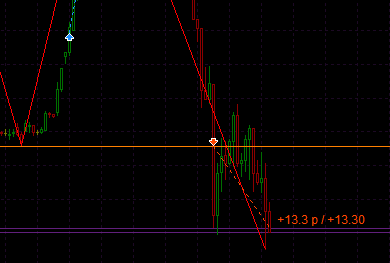
ZigZag Filter
ZZ filter type
Type of ZZ filter:
- Disabled: ZZ filter disabled
- Extremum break
-
BUYs are allowed on the bar breaking UP the last formed extremum of ZZ:

-
SELLs are allowed on the bar breaking DOWN the last formed extremum of ZZ:
-
- Trend continue (last broken extremum direction)
Can be used as a filter to other signals.
-
BUYs are allowed after the last UP-break and till the next peak of ZZ is formed:

-
SELLs are allowed after the last DOWN-break and till the next bottom is formed:

-
- Reversion point
-
BUYs are allowed when the DOWN-section of ZZ is forming and the distance between the last top and the current price becomes big enough:

-
SELLs are allowed when the UP-section of ZZ is forming and the distance between the last bottom and the current price becomes big enough:

-
- Counter-trend (distance from last extremum)
Can be used as a filter to other signals
-
BUYs are allowed when the DOWN-section of ZZ is forming and the distance between the last top and the current price is big enough:

-
SELLs are allowed when the UP-section of ZZ is forming and the distance between the last bottom and the current price is big enough

-
TimeFrame
TimeFrame for ZZ filter
ZZ indicator properties
- Period
- Min Amplitude
- Min Motion
Distance type
Distance calculation type:
- In Points (what is a “point”?)
-
As a Volatility Coefficient (volatility parameters must be set correctly)
- As a Percentage of Price (asset price * Percentage / 100)
Distance size (Points / Coefficient)
Distance size for signal calculation.
Distance can be set negative (so, in Extremum break mode trade will be opened before X points before extremum break)
Use previous unbroken extremums
If enabled, previous (unbroken) extremums will be used after the last extremum is broken:

Reverse mode
Reverse all ZZ signals
Use closed bars only
Use only closed (formed) bars. If true, the signal can’t change in the middle of the bar.
Visualization parameters
- Visualize levels (true/false)
- Fill rectangle (true/false)
- Color UP
- Color DN
Enable visualization to understand signals better.
Volatility for MA, ZZ, Line and Pivot filters distance
Starting from v3.01, common volatility settings are used for these filters.
Volatility Filter
Volatility Filter Indicator
Indicator for the Volatility Filter:
- Disabled: Volatility Filter disabled
- ATR
- StDev
- ATR (Close-Open): average candle body size (
abs(Close - Open)) for the last N bars - WATR
- Volume
- OBV
- Price Range: highest high - lowest low for the last N bars
- Percent Change: average change (
abs(close_curr - close_prev)) for the last N bars
Volatility Filter TimeFrame
TimeFrame for the Volatility Filter
Indicator Period
Selected Volatility indicator period
Transformation Period
Transformation period for Volatility filter.
If period is positive, volatility is calculated as indy_1 * indy_1 / indy_2 where:
indy_1- is the selected volatility indicator with the selected periodindy_2- is the selected volatility indicator with the selected transformation period
If period is negative, volatility is calculated as indy_1 / indy_2 (ratio of two indicators) (starting from v2.59.1)
For example, you can allow trades only when the fast (current) volatility is greater than the slow (long term) volatility (ratio >= Min Volatility)
Set 0 to disable this transformation.
Volatility Coefficient
If set, volatility value is multiplied by this coefficient.
Set 0 to disable this coefficient.
Invert/Smooth Period
If Invert/Smooth Period > 0, indicator value will be inverted against the MA with this period based on the indicator value.
For example, if Invert/Smooth Period = 5, MA(5) will be applied to the indicator value, and the final value will be calculated as MA(5) - (indicator value - MA(5)).
If Invert/Smooth Period < 0, indicator value will be smoothed with the MA with this period.
For example, if Invert/Smooth Period = -5, MA(5) will be applied to the indicator value, and the final value will be equal to MA(5).
To understand this parameter better, you can use the iVolatility indicator: for MT4 and for MT5.
Min Volatility
Min volatility (in points) (what is a “point”?) or ratio (if Transformation period is negative) to allow new trade (both buy and sell).
Set 0 to disable minimum volatility value.
Max Volatility
Max volatility (in points) (what is a “point”?) or ratio (if Transformation period is negative) to allow new trade (both buy and sell).
Set 0 to disable maximum volatility value.
For example, if you set Volatility Indicator = ATR, and Volatility Period = 20, and Min Volatility (in points) = 10, you’ll have trades in the green zones only:

Smoothing Filter
Smoothing Volatility filter. Can be one of following:
- Disable Smoothing Filter: filter disabled
- Allow trade on growth (Volatility > MA): new trade is allowed only if the Volatility indicator is greater than MA based on it.
- Allow trade on reduce (Volatility < MA): new trade is allowed only if the Volatility indicator is lower than MA based on it.
Smoothing Period
MA period for Smoothing Volatility filter
Fibo Filters
(starting from v2.17, improved in v2.24, improved in v2.25)
Type
Type of Fibo filter:
- Disabled: Fibo filter disabled
- On retracement:
- BUYs are allowed if Trend is Bullish and Price <= FiboLevel
- SELLs are allowed if Trend is Bearish and Price >= FiboLevel
- On retracement + opposite direction:
- BUYs are allowed if Trend is Bullish and Price <= FiboLevel or Trend is Bearish
- SELLs are allowed if Trend is Bearish and Price >= FiboLevel or Trend is Bullish
- On trend reversal:
- BUYs are allowed if Trend is Bearish and Price <= FiboLevel
- SELLs are allowed if Trend is Bullish and Price >= FiboLevel
Fibo retracement is placed automatically from the lowest Low to the highest High based on specified Bars number and TimeFrame.
Trend is Bullish means the highest High happened after the lowest Low:

Trend is Bearish means the highest High happened before the lowest Low:

FiboLevel is set by parameter.
Check Interval
Signal check frequency and price used:
- Every bar of indy TF: check signal on every bar of the FIBO TimeFrame, use Close price of the last bar
- Every tick: check signal on every tick, use Bid price
- Every M1 bar: check signal every M1 bar, use Close price of the last M1 bar
- Every M5 bar: check signal every M5 bar, use Close price of the last M5 bar
- and so on…
Bars for range calculation
The number of bars used to find extremums.
MACD bars for extremums detection
You can use MACD for price extremums detection:
- High extremum will be located on positive MACD waves,
- Low extremums will be located on negative MACD waves.
Minimum wave width is defined by this parameter.
Set 0 to disable MACD extremums detection.
Fibo level
Fibo level used for signal
Use closed bars only
If Use closed bars only = true, FIBO levels recalculate every bar of selected TimeFrame. Otherwise, FIBO recalculates every tick.
Custom Indicators
Custom label
Short and understandable name of your custom indy to draw on the GUI, write to the expert logs and send via Grammy to your Telegram
Type
Custom indicator signal type. Can be one of the following:
-
Disabled: custom indicator signal disabled.
- On arrow (non-empty buffer):
- BUYs are allowed on every bar with some value in the Buy-buffer
- SELLs are allowed on every bar with some value in the Sell-buffer
Non-empty means any value. It can look like an arrow, like a line, like a histogram or even be invisible (calculation buffer).
- On new arrow (non-empty after empty):
- BUYs are allowed on the bar with some value in the Buy-buffer that follows a bar with an empty value the Buy-buffer
- SELLs are allowed on the bar with some value in the Sell-buffer that follows a bar with an empty value in the Sell-buffer
It can be an arrow, beginning of the line, first bar of histogram (after emptiness), etc..
- In the direction of the last arrow:
- BUYs are allowed if the last bar with some value in the Buy-buffer was later than the last bar with some value in the Sell-buffer
- SELLs are allowed if the last bar with some value in the Sell-buffer was later than the last bar with some value in the Buy-buffer
If both buffers are not empty on the same bar, both BUYs and SELLs are allowed after it.
For example, if the latest arrow is UP, buys are allowed, if the latest arrow is DN, sells are allowed, and if there are both arrows on the same bar, both buys and sells are allowed after it.
- Above/below the line/last arrow
- BUYs are allowed if the close price is above the line/arrow in the Buy-buffer.
- SELLs are allowed if the close price is below the line/arrow in the Sell-buffer.
If the buffer is empty, the last bar with some value in the buffer is used.
- On line/last arrow cross
- BUYs are allowed on the bar where the close price crosses above the line/arrow in the Buy-buffer.
- SELLs are allowed on the bar where the close price crosses below the line/arrow in the Sell-buffer.
If the buffer is empty, the last bar with some value in the buffer is used. For arrows, only the first cross is used.
- On lines cross:
- BUYs are allowed on the bar where line from the Buy-buffer crosses above the line from the Sell-buffer
- SELLs are allowed on the bar where line from the Buy-buffer crosses below the line from the Sell-buffer
- On lines position:
- BUYs are allowed on every bar where line from the Buy-buffer is above the line from the Sell-buffer
- SELLs are allowed on every bar where line from the Buy-buffer is below the line from the Sell-buffer
TimeFrame
TimeFrame for the signal
Indicator path and name
Name of the indicator you want to use.
If it is located not in the “MQL5\Indicators" folder, the path should be specified too.
For example, if your indicator “SuperTrend.ex5” is in the “MQL5\Indicators\Market" folder, you should set the Indicator path and name = “Market\SuperTrend”.
Indicator parameters
Indicator parameters separated by commas.
Order and type of parameters must match the original order and type of indicator parameters.
String parameters must be enclosed in single quotes.
Starting from v2.58, you can use “INPUT_XX” macros to replace the parameter value with the special parameter that could be optimized.
Warning
Indicators with 'parameters groups' can't be used with parameters specified!Buy buffer number
Buy-buffer — is an indicator buffer with index Buy buffer number (numeration starts from 0)
Sell buffer number
Sell-buffer — is an indicator buffer with index Sell buffer number (numeration starts from 0)
Set -1 to use the same buffer index as for Buy.
Color buffer number and index
If both Buy color buffer number and Buy color index are set (>= 0), color filtering is applied for all values in Buy-buffer: if the value in the Buy color buffer number differs from Buy color index, value in Buy-buffer is considered as empty.
For example, if the indicator draws arrows for both buy and sell signals using buffer #0, and applies colors to these arrows using buffer #1 (first is green, means buy, second is red, means sell), you should set:
- Signal type = On arrow / On new arrow
- Buy buffer number = 0
- Sell buffer number = 0
- Buy color buffer number = 1
- Sell color buffer number = 1
- Buy color index = 0
- and Sell color index = 1
Thus, buy-signal will appear after the green arrow, and sell-signal — after red.
Another example: indicator draws color line and color arrows. If you open its settings, you will see the following:

If you go to source code, you can find something like this:

Buffer #0 (LineBuffer) corresponds to the line, buffer #1 (LineColors) — to the colors of the line.
Buffers #2 (UpBuffer) and #3 (DownBuffer) correspond to the arrows.
So, if you want to allow buys on the blue line and sells on the red line, you should set:
- Signal type = On arrow (non-empty buffer)
- Buy buffer number = 0
- Sell buffer number = 0
- Buy color buffer number = 1
- Sell color buffer number = 1
- Buy color index = 1 (because blue color index is 1, counting from 0)
- and Sell color index = 0 (because red color index is 0, counting from 0)
Or, if you want to entry on the color arrows, you should set:
- Signal type = On new arrow (non-empty after empty)
- Buy buffer number = 2
- Sell buffer number = 3
- Buy color buffer number = -1 (no need to set, because arrows of different colors are in different buffers)
- Sell color buffer number = -1 (no need to set, because arrows of different colors are in different buffers)
- Buy color index = -1 (no need to set)
- and Sell color index = -1 (no need to set)
Max/min level
If the value in the Buy-buffer is greater than Buy max level, it is considered as empty.
If the value in the Buy-buffer is less than Buy min level, it is considered as empty.
The same for Sell-buffer.
Levels can be used:
- for Oscillator signals:
- Stochastic in On new arrow (non-empty after empty) mode with Buy max = 20 / Sell min = 80 will generate signals on Main line cross levels 80 (sell) and 20 (buy)
- for Trend filter signals:
- MACD in On arrow (non-empty buffer) mode with Buy min = 0 / Sell max = 0 will filter all buys below 0 line and all sells above 0 level.
Set -999 to disable filtering by levels.
Reverse mode
Reverse all CustomIndy signals
Use bar
Number of the bar to use for the signal calculation.
0 means the current (unformed) bar, 1 means the previous (last formed) bar, 2 means the bar before the previous, etc.
Default value for CustomIndy is 1.
Short indicator name, Draw in subwindow
These parameters should be set for correct work of the CP GUI (show/hide indicator by clicking on signal label).
Short indicator name must match the indicator name as it is shown in the Data window.
Draw in subwindow must be set to True for all indicators that draw in sub-windows (oscillators, MACD, ADX, etc) and to False for others.
Allow negative and zero values
Set True for indicators that can contain 0 or negative value by design (for example, MACD).
Set False for indicators that draw arrows and fill empty values with zeros (not EMPTY_VALUE constant).
Optimization Inputs
Specifying Indicator parameters, you can put “INPUT_XX” instead of the actual value of the parameter. In this case, the value of the parameter will be taken from the special parameter “INPUT_XX” from this block.
For example, you can set “Indicator parameters” for MACD as “INPUT_01,INPUT_02,INPUT_03”, and set “INPUT_01” = 12, “INPUT_02” = 26, “INPUT_03” = 9 in this block. Then, if you want to optimize MACD parameters, you can optimize values of “INPUT_01”, “INPUT_02” and “INPUT_03”.
Spread Filter
Max current spread
Max spread (in points) (what is a “point”?) for positions opening.
Set 0 to disable the filter.
Max average spread, Seconds for averaging
Max average spread (in points) (what is a “point”?) for positions opening and the number of seconds to calculate it.
Set 0 to disable the filter.
M1 bars to calculate ‘normal’ spread
If enabled, EA will calculate the ‘normal’ spread: the average spread for the specified number of M1 bars.
For now, this value is used:
- for the MA filters to calculate the correction size: MA on the current bar is corrected by the half of the ‘normal’ spread. Thus, signals for the pairs with high spread will be symmetrical.
- for the Distance calculation: indicator value is limited by the Min volatility to use (spreads)
Set 0 to disable this correction.
Apply to first open
Set true to apply the spread filter to the open of the first position in a series.
Apply to martin
Set true to apply the spread filter to the open of the martingale and anti-martingale positions.
Apply to hedge
Set true to apply the spread filter to the open of the hedge positions.
Apply to close
Set true to apply the spread filter to the closing by StopLoss.